Building Algorithms
Algorithm is a set of instructions
Question: How do I send a text message? I will create an algorithm for sending a text message
- Find a phone (Phone = Small Computer)
- Turn on
- If it is a smart phone you have to open it by touching the screen
- Authenticate (If your phone has a password then enter that information now)
- Once you get in find the home screen when you enter info
- touch the chat bubble button
- hit the blue box
- Contact list
- Select person name
- type message
- hit green button send
- you know you made it happen when your message makes a noise and it is green
pseu·do·code
- a notation resembling a simplified programming language, used in program design.
In computer science, pseudocode is an informal high-level description of the operating principle of a computer program or other algorithm. It uses the structural conventions of a normal programming language, but is intended for human reading rather than machine reading
Creating an algorithm for our products
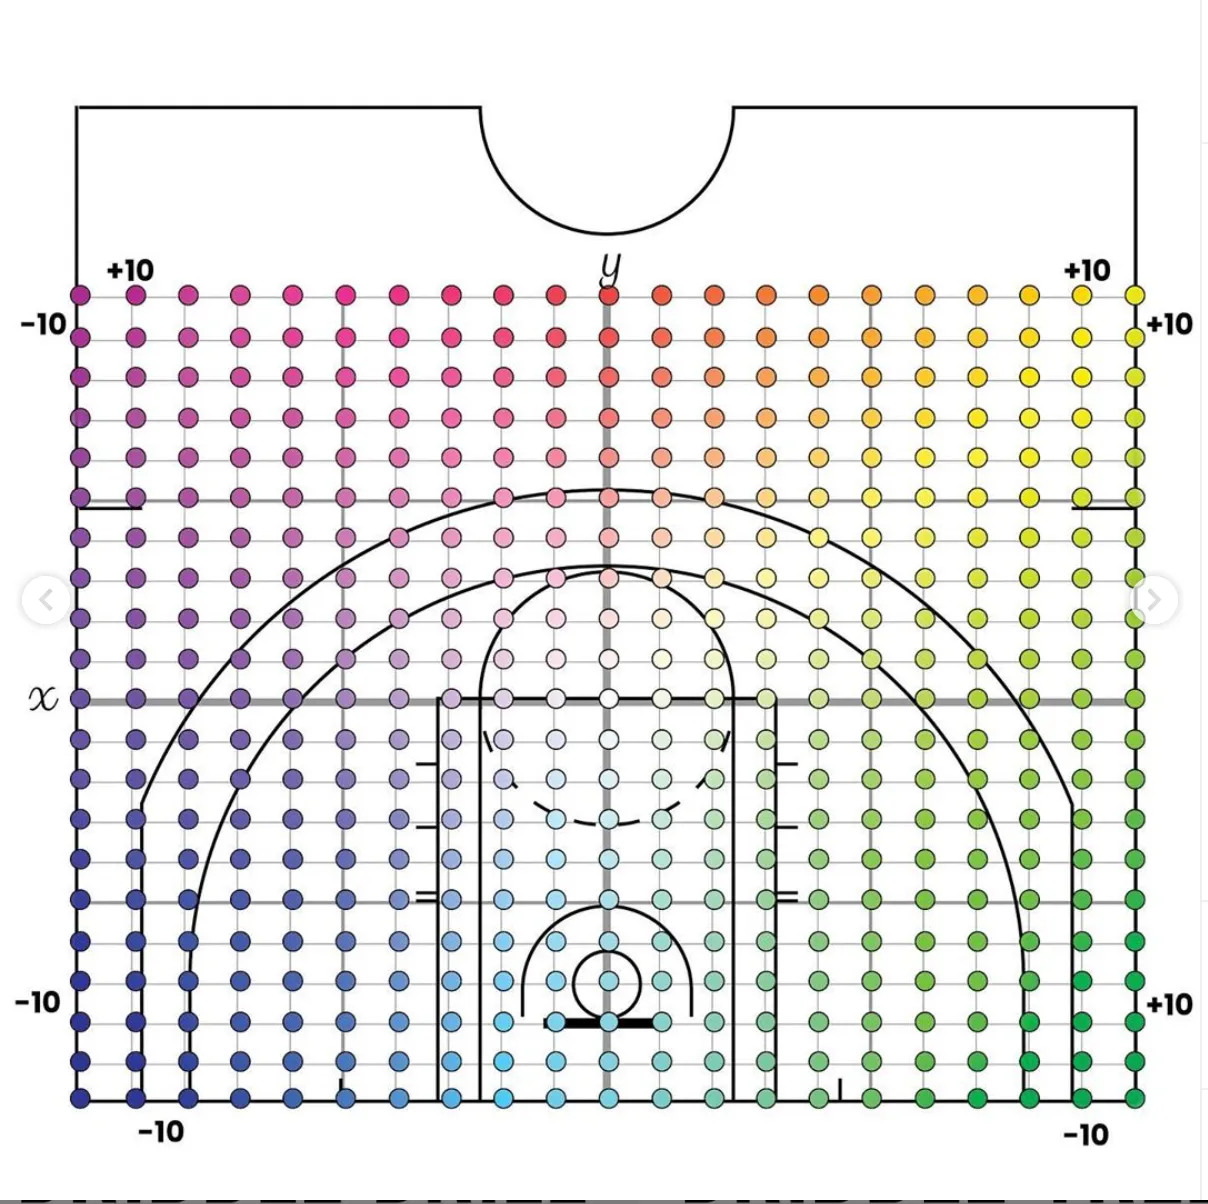
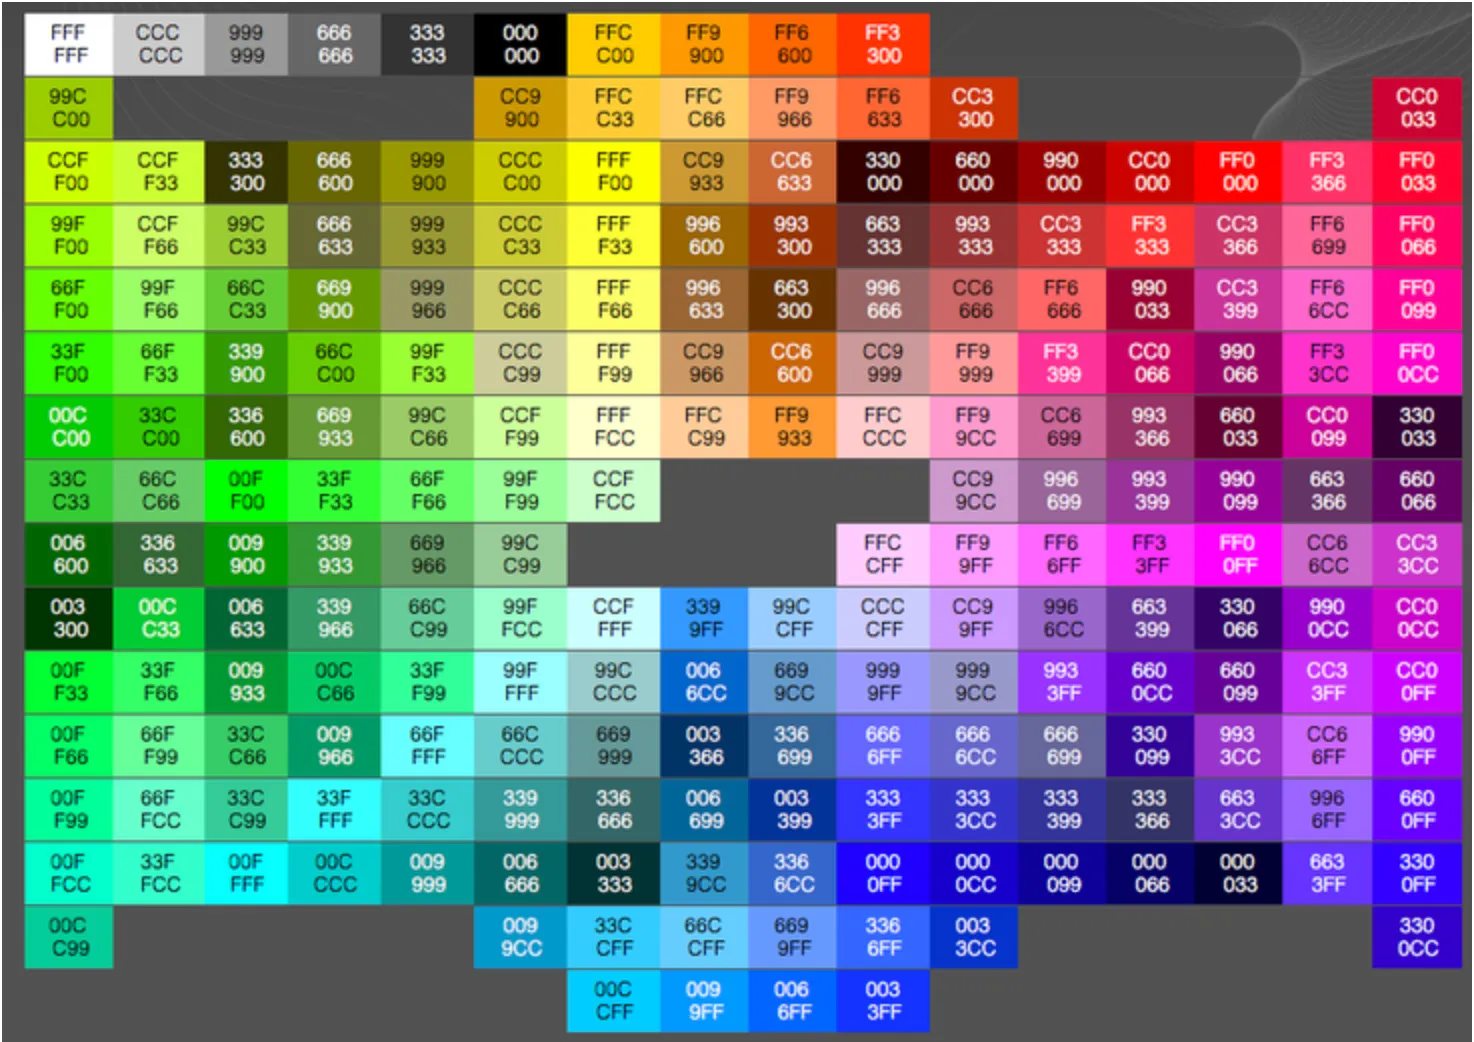
How can I design an algorithm so I can have each player ploted on our x,y axis, court arc, and color grid? This is an example of our color grid. Within this color grid we are are able to develop a system that uses computer thinking. What I mean by this is we use the hexidecimal color system mapped on to the court.
We want our grid to map each players shot chart. When they take a shot it will be shown in a color system that can tell you a box score/story of the particular players performance. When you shoot at a specific spot it is a certain color. This enables us to have the ability to know where a person shots. Currently the NBA does not show this type of data in their advanced stats section of their website.

We discussed this map as well. I learned more about a matrix today and how that can help me in the process of creating this.
We also explored the nba advanced data site and discovered player tracking some more. It tells you in what area of the court the player was when they are taking a shot and some of the information about what they were doing in some cases.
We need to make the distinctions of the hexidecimal color chart so that everyone can understand where a player is on the court.
Think about data coorilation. Think about how to define putting the player in a specific location. We have to make our own way of defining our system
similar to a Second Spectrum. When we label the actual colors our grid will enable us to have a great visual representation of where a player takes a shot.

Model Input - 4 players Output - What player is better