Scatter Plots
Huge moment for me
I learned how to do scatter plots by myself without any help from my instructor today. It was a big accomplishment for me.
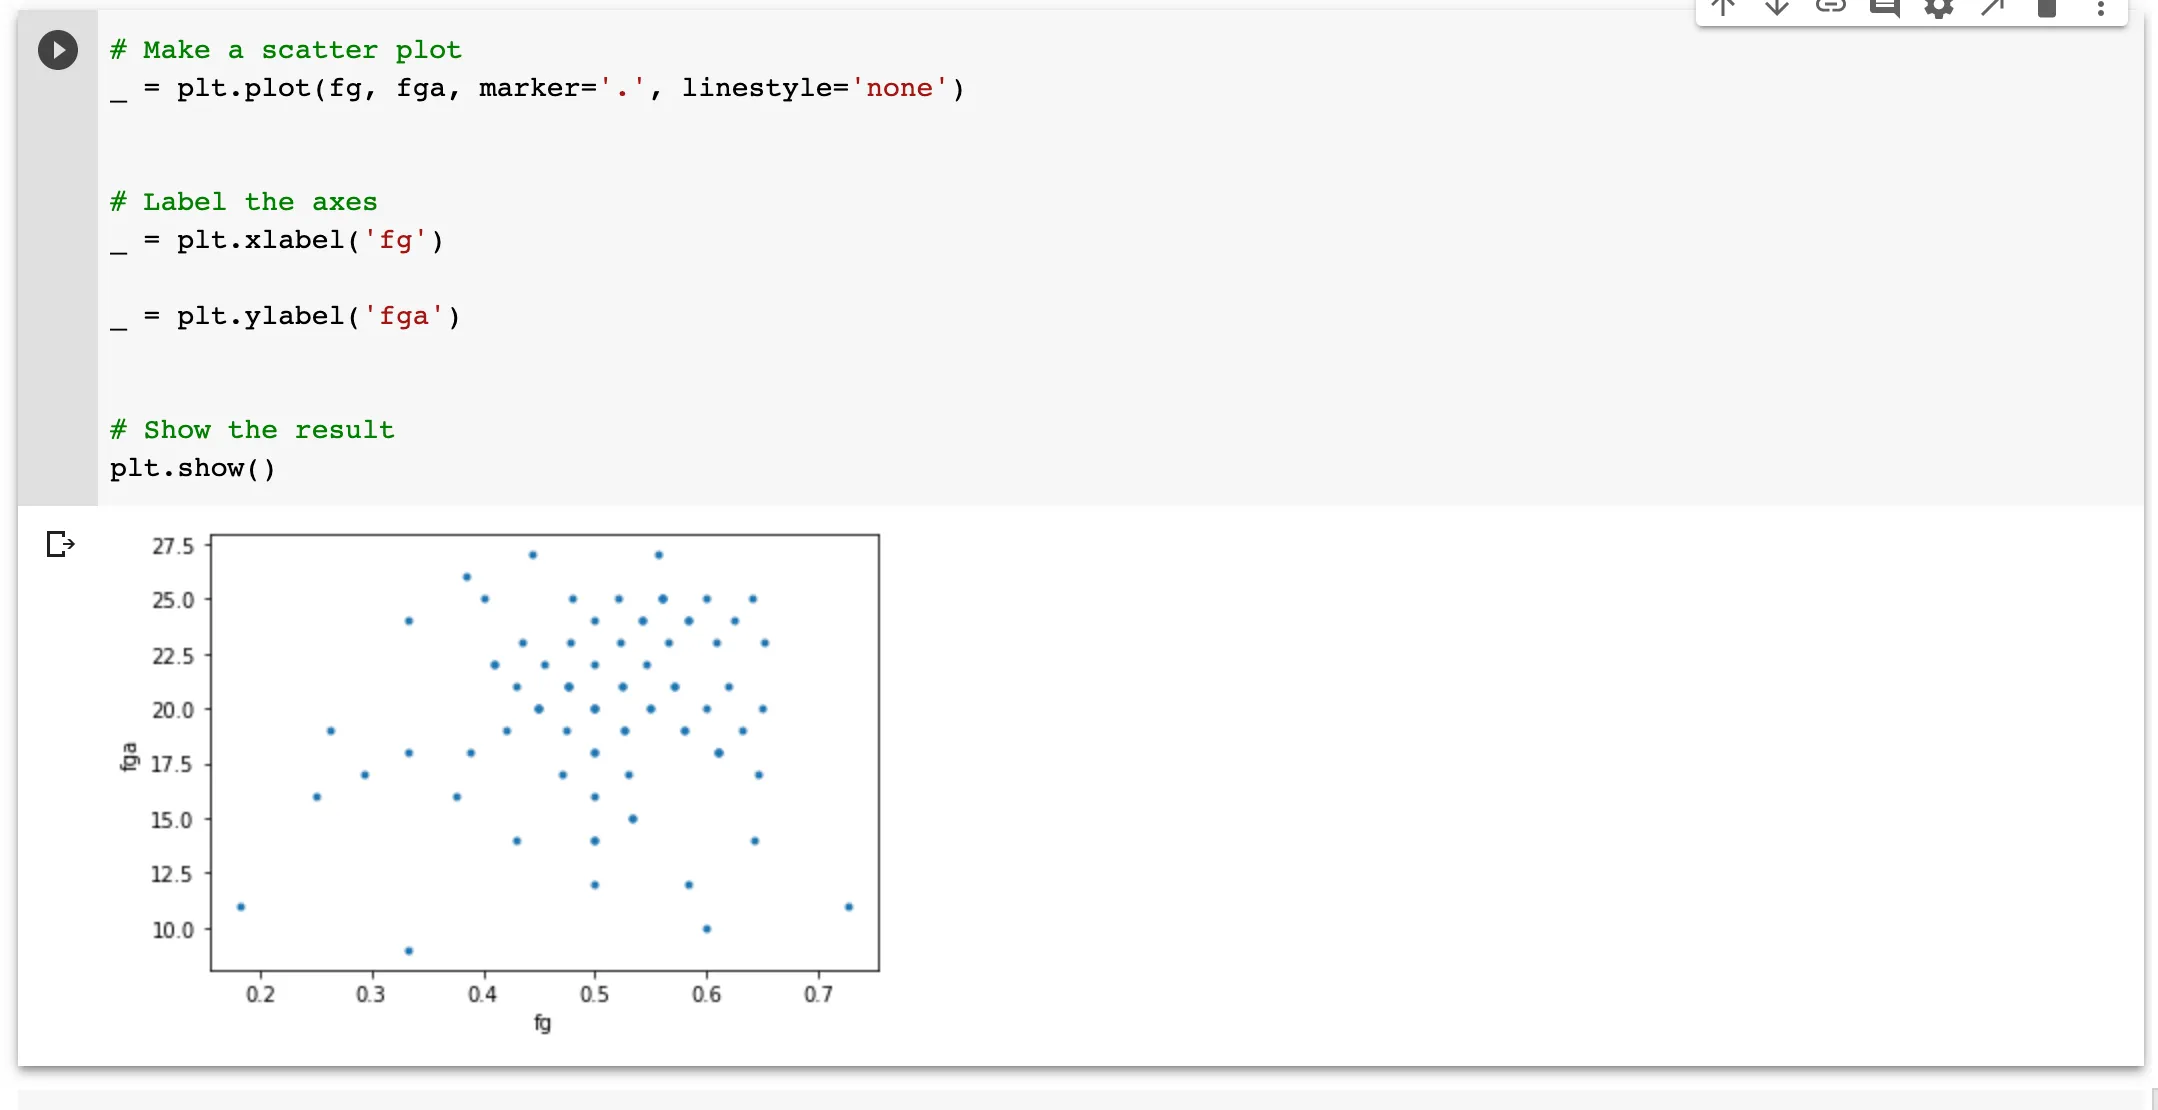
Here is what the scatter plot looks like. This particular scatter plot is for FGs vs. FG% for Chris Mullens best season.

I will proceed to play around with this data set. Soon I will start working on the data set that will enable me to determine who the best point guard shooter of all time is. I just need a little more practice :).